I’ll admit it: I’m procrastinating again. But what of it?
So here’s what I’ve done. I took the game logs for the 2012 season and removed all intra-divisional matches. So out of the 2,430 games played last season, this left 1,358 games — all of them played between teams from different divisions.
Then I totaled up the collective wins for all teams within each division — again, excluding games played against each other — and came up with winning percentages for each of the six divisions. Here’s how it panned out:
AL West: 237-183 (.564)
AL East: 240-210 (.533)
NL East: 236-214 (.524)
NL West: 221-229 (.491)
NL Central: 225-271 (.454)
AL Central: 199-251 (.442)
I have yet to look into these figures on a historical continuum, but I’m guessing it’s a rarity for the AL East (traditionally thought of as the toughest division in baseball, at least for some time now) to be knocked off its perch at the top.
Anyone have a better way of measuring division strength? I’ve seen some articles written over the past few years that count all postseason series won (or even participated in) by teams from the various divisions. But since postseason success is partially determined by how a team performs within its own division, I’m not convinced that counting postseason series is the best way to measure division strength — especially given baseball’s disproportionately intra-division game schedules. Team performances against division rivals should be discounted from evaluations of overall division strength.
The division that set the standard for sameness is virtually unrecognizable these days.
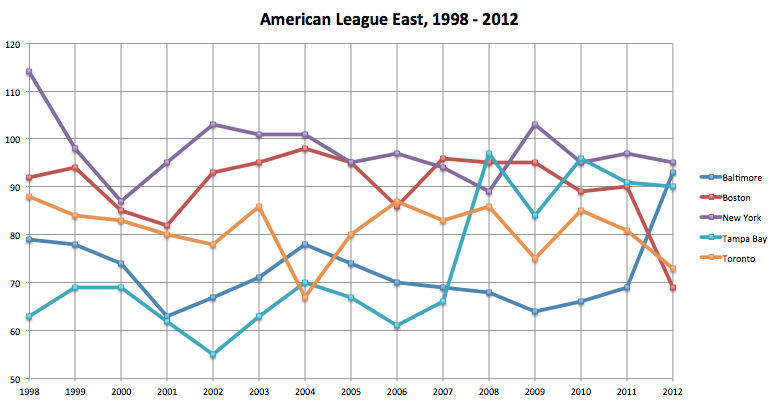
Just a decade ago, the American League East race was the most predictable competition in sports. From 1998 through 2003, the five East teams finished in exactly the same order, every single year. Six straight seasons with the Yankees on top, the (Devil) Rays on the bottom, and the Red Sox, Blue Jays and Orioles in order in between. It was baseball’s version of a caste system…
As the 2013 campaign approaches, though, that predictability is gone. Last year offered a taste, but this year might bring full-on chaos. And that’s great news — unless you’re a Yankees fan.
All five teams could finish in different positions than they did a year ago. Every club in the division has reason to think it can finish first. Every team in the division has reason to fear a flop. You want wide-open? You’ve got it.
The Yankees and Red Sox both appear to be very expensive, mortal teams. The Tampa Bay Rays have several question marks on their roster. The Toronto Blue Jays have completely overhauled their roster, though how it will play out on the field remains to be seen. The Baltimore Orioles have stood pat thus far after a dream season one year ago.
The AL East seems as wide open as ever. Five teams are roughly capable of competing with one another, though many would score the Rays, Jays and Yankees as the favorites to come away with the division crown. Yet, with so much parity in the “toughest division in sports”, there has never been more reason to feel that the AL East has wandered into vulnerability.
The graph above tells the story. The biggest season-over-season improvement for any one team in the AL East over that 15-year period was that of the Tampa Bay Rays from 2007 to 2008. Not only did they improve from 66 to 97 wins — an astounding 31-win jump — but they literally changed their name as well. (In 2007, they were the Tampa Bay Devil Rays. The next year they became the Tampa Bay Rays.)
As for the single biggest drop, that dubious distinction belongs to my beloved Boston Red Sox, whose collapse this past year — 69 wins, versus 90 in 2011 — was really just a continuation of the disaster begun in September 2011.
Zooming out to include all Major League Baseball teams, I’ve analyzed every year-over-year win differential since 1996/1997. (Although the current divisional format began in 1994, both that season and the subsequent one were shortened by the infamous strike.) The largest change in win total from one year to the next took place from 1997 to 1998, when the Florida Marlins’ record plummeted from 92-70 in their sophomore year to 54-108 the next season. Going in the other direction, the 1999 Arizona Diamondbacks improved on their 1998 total by 35 wins, jumping from an abysmal 65-97 record in their inaugural year to 100-62 in the followup.
The 2007/2008 jump of 31 wins for the Tampa Bay (Devil) Rays is second only to that leap by the Diamondbacks, going all the way back to 1996/1997 (a period that encompasses 506 entire team-seasons). Conversely, it provides me only a modicum of relief to note that the 2012 Red Sox’ 21-win dip is only bad enough to tie for 16th-worst year-over-year decline in that period — along with the 2002 Chicago Cubs (2001: 88-74; 2002: 67-95) and 2012 Philadelphia Phillies (2011: 102-60; 2012: 81-81).
Let’s just say I’m looking forward to putting all of this behind us for 2013. Oh, and go Red Sox.