 As most of the world knows by now — and by that I refer mainly to people like the ones that populate my Twitter feed — Andrew Sullivan has cut himself loose. On Monday, February 4th, The Dish officially switched over from the Daily Beast to Sullivan’s own WordPress-hosted site.
The change comes with a few extra bells and whistles: no ads or clutter, automatic resizing on smartphones (although this has yet to work on my iPhone), infinite scrolling, and so on. Probably my favorite new feature is the search engine — or as Sullivan put it, “I have given a sharp dagger for anyone who wants to make me look foolish.” On the very first day his new site appeared, in fact, I inadvertently stumbled upon this gem from October 2002:
The last phony anti-war argument was that President Bush had yet to “make the case” for war against Iraq, as if grown-ups didn’t have the capacity to make their own minds up on the issue without constant guidance from the commander-in-chief. But that surely must now be in tatters as a point, since the president has made speech after speech in the last year clearly laying out the rationale for the war on terror, a rationale that has always included defanging Saddam.
Oops.
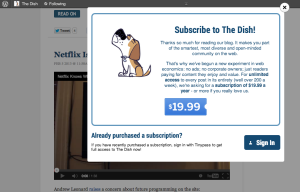
Anyway, the main transformation of The Dish is that it will now charge for its content. More precisely, after seven “Read On” clicks within a 30-day period, readers will be directed to a subscription page, where they’ll be able to sign up for a year of The Dish at the very manageable annual rate of $19.99.
As a medium-intensity Dish obsessive (on the spectrum, I’m somewhere between “regular reader” and “currently tattooing the Dish beagle to my forehead”) and aspiring journalist, I took great interest in Sullivan’s gamble, which basically amounted to throwing off the corporate chains — chains that were accompanied, of course, by a large financial backing — and going it alone. I began to wonder, as did many other readers, how the switch from a principally advertising-supported venture to one backed directly by the readers would affect the content and form of The Dish itself.
This being Andrew Sullivan, he was only too happy to share his readers’ concerns in the days leading up to the switchover. (In fact, Sullivan’s masochistic willingness, rare among bloggers, to frequently publish reader emails excoriating his commentary is one of the main reasons I was so happy to subscribe to the new reader-supported iteration of The Dish.)
After Sullivan published one reader’s blunt adieu to The Dish on January 3rd — “For better or worse I like my Internet free,” (s)he declared, and then, one hopes, enrolled in Microeconomics 101 — he reassured his audience: “A reminder to our reader and others that the vast majority of Dish content will remain free to non-members.”
Two weeks later, in response to more reader reactions, Sullivan again noted: “Even if all of my longer posts are metered, only a portion of my writing will go behind the read-on, thus allowing all readers to get the gist of the post, regardless of subscription.”
Perhaps most interestingly to me, however, was the cautionary point raised by another reader several days earlier:
Another reader worries that “there may be potential copyright issues if it was less than 50% original content/comments by the Dish team with a “charge” being issued by the Dish.” But another writes:
The read-on might actually work to the external sources’ advantage, in that non-payers will then have more reason to follow the link to the original if they’re interested.
The above-mentioned post, in fact, contained a variety of creative suggestions from readers as to how, exactly, Sullivan should handle the “Read On” issue. Now that all content beyond the “Read On” button (after the first seven monthly clicks, that is) requires payment, it would be interesting to see just what type of content Sullivan is placing behind the “paywall” (a term Sullivan himself dislikes but which more or less describes his new model).
Long story short: I’ve just now completed such a study. First, I analyzed every post on The Dish in the one-week period from January 1 to January 7, 2013, in which I categorized each entry by:
A) whether it included a “Read On” button
B) what type of content came before the “Read On” button (as in, the part that is visible without expanding the post): (1) primarily Sullivan and/or reader commentary, (2) primarily third-party content (e.g. excerpts from an article, column, or essay), or (3) a combination of both Sullivan/readers and third-party content (as when Sullivan excerpts articles and then critiques their points, rather than, for example, simply excerpting another article rebutting the first one)
C) what type of content came beyond the “Read On” button (using the same criteria), if there was one
I chose the first week of 2013 (somewhat arbitrarily) as my control group because it preceded the implementation of the meter model. I then performed the same analysis on all posts on The Dish in the week from February 4th (the first full day under the new meter model) to February 10th. (All times are in EST, by the way.)
A few caveats are in order. First, as Andrew Sullivan himself made clear, the opening week of his new site is not exactly a perfect representation of how the “Read On” button will be utilized in the future. On February 6th, in response to a reader who questioned the additional value granted by subscribing, Sullivan noted:
That’s because after two days, we’ve been going easy on the meter. We’ll adjust as we go along. We want to keep the majority of the site free, but the deeper analyses, reader threads, my own writing, and other features will slowly become less accessible to the non-subscriber. It’s a balance, and we’re trying to figure our way forward with it.
As you will see below, so far this formulation has meant a significant departure from Sullivan’s use of “Read On” prior to the advent of the meter. Back then, in my sample, over two-thirds of all “Read On” segments — that is, the portions of his posts that lay beyond the “Read On” button — consisted primarily of third-party content. Now, however, “deeper analyses, reader threads, [his] own writing, and other features” have gained an increasing share of the “Read On” pie. (Again, keep in mind that things are still in flux: it’s only been a week.)
A second caution applies to my criteria for categorizing the posts. Obviously, there is a small subjective element to the endeavor. However, this is probably much less significant than one might think: the vast majority of posts on The Dish — and this applies equally to the “Read On” and non-“Read On” sections of each post — quite clearly fall into one of the three categories specified above: content produced primarily by Andrew and/or his readers, content produced primarily by third parties, and content containing a mixture of both.
To use some of his more popular features as an example, both sections of a typical “View From Your Window” post (both the content before and beyond the “Read On” button, in other words) would obviously fall into the first category. A “Mental Health Break,” which rarely contains a “Read On” button, would usually fit into the second, since these posts generally consist of a video produced by someone else with no more than an accompanying line or two from Sullivan. And an “Yglesias Award Nominee” post, while possibly fitting into the second category, often instead went into the third — as Sullivan frequently added his own commentary to the quote itself (either in the pre- or post-“Read On” sections of the post). Anyway, in the interest of transparency, I have included a link to my full Excel spreadsheet analysis here.
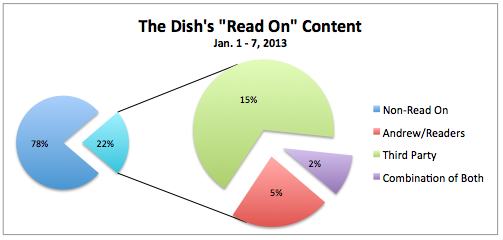
Bottom line: Andrew Sullivan has almost perfectly inverted his “Read On” content from before to after the implementation of the meter. From January 1 to 7, he posted 231 times; of those, only 52 (22.5%) included “Read On” buttons. Of those 52 “Read On” sections, 35 consisted primarily of third-party content (67.3%), 12 mostly contained material produced by Andrew and his readers (23.1%), and the remaining 5 were a combination of Andrew/readers and third-party content (9.6%).
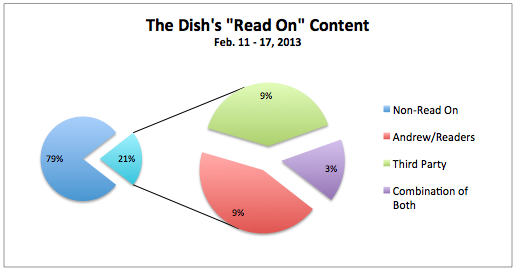
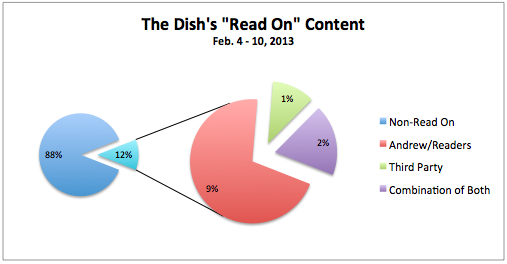
From February 4 to 10, however, several things changed. The number of total posts was almost identical to the January period (227), but — as he promised — there were significantly fewer “Read On” posts in the first week of the new meter (27, or only 11.9% of the total). Of those 27, 19 contained content primarily contributed by Andrew and his readers (70.4%), 5 contained a combination (18.5%), and only 3 “Read On” sections during the entire week contained content mostly attributable to third parties (11.1%, or 1.3% of the entire population of posts this past week).
Of course, only time will tell if this trend of more original material after the “Read On” button continues. It would certainly make sense, since this section is now being charged for after seven monthly clicks (which probably took the average Dish reader, what, five minutes to hit on February 4th?). I’d expect the percentage of posts that contain “Read On” buttons to rise pretty soon, because that’s one of the primary added-value propositions of subscribing. But I suppose how quickly this all happens will depend on a number of factors, including how many new subscribers Sullivan is scooping up on a regular basis now that more and more casual readers are starting to hit the meter.
In any case, I’m excited to see a blogger of Sullivan’s caliber jumping into such a bold experiment, and I wish him the best! I certainly don’t always agree with him, but even when he’s wrong, he’s never boring.