Tag Archives: blogging

The year in 10 posts

I’m not usually a List Guy, and I’m even less a Listicle Guy (nor do I know the difference). But given the recent dearth of writing on this blog dealing with non-Homeland subjects, the end of the year seemed like an appropriate time to select 10 posts from 2013.

Note that these aren’t necessarily my 10 favorite posts, nor were they all posted this year (one wasn’t), nor were they even the ones that garnered the most views (although this category is the general baseline I used to compile the selection below). It is simply a list that expresses, in some abstract or nonsensical way perhaps, The First Casualty in the year that was. Or more accurately, the year that is, until Wednesday.

So without further commentary:

10) “Did you get into Harvard?!?” by Sam Lim (April 6)

Money quote: “While the general perception is that having a degree from an Ivy League school, Stanford, or MIT automatically trumps a degree from most other institutions, the truth is our focus should be on the substance of the degrees and not the degrees themselves.”

9) “At Fernandez v. California Oral Argument, Supreme Court Debates What It Means To Be Roommates” by Victoria Kwan (November 14)

Money quote: “From today’s argument, it looks as though the Supreme Court will reduce Georgia v. Randolph to ‘nothingness,’ as Justice Ginsburg mused. Sotomayor may be able to convince Ginsburg and Kagan, who both showed some discomfort with the amount of control their conservative colleagues would hand to the police. She might also get Breyer’s vote if she can somehow figure out a test that is consistent with both his Randolph concurrence and his desire to limit it in situations like these. Without the support of Scalia, however, the list of justices supporting Fernandez’s claim is stuck at four, which, in the Supreme Court, is still a losing number.”

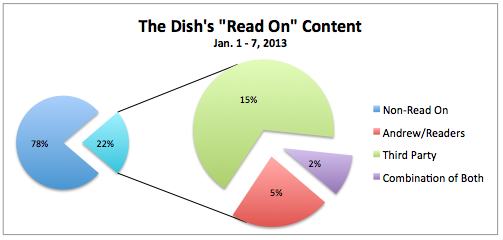
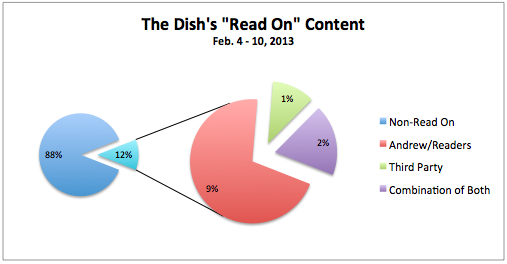
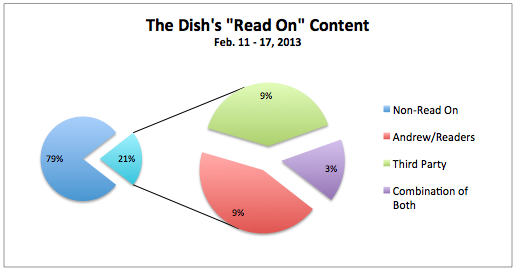
8) “Beyond the Dish meter, part II” by Jay Pinho (February 18)

Money quote: “I believe Sullivan mentioned recently that if the pace of subscribers didn’t pick up, he may ‘nudge’ them towards paying their dues. This could happen in one of two ways. Either he could reduce the number of monthly “Read On” clicks it takes to trigger the meter (it’s currently at seven), or he could introduce more “Read On” posts as a percentage of his total posts. As an early subscriber, it doesn’t really matter to me which one he chooses. But so far at least, the content lying beyond the “Read On” button certainly seems to justify the annual fee.”

7) ‘Too Far, Too Fast:’ A Timeline of Ruth Bader Ginsburg’s Disappointment with Roe v. Wade” by Victoria Kwan (May 14)

Money quote: “Though Justice Ginsburg’s remarks may be particularly relevant now–her preferred bottom-up, state-by-state approach to abortion mirrors the strategy that same-sex marriage advocates have been using–this isn’t the first time that the justice has publicly expressed disappointment with Roe’s lack of judicial restraint. Over the years, Ginsburg has been quite vocal about the many roads not taken, even while she approves of the outcome of increased access to abortion.”

6) “‘The Choice’ to stay: Sam Lim and I discuss the season finale of Homeland” by Sam Lim and Jay Pinho (December 18, 2012)

Money quote: “So it looks like that’s our two-man consensus: Saul and Carrie’s relationship takes a turn for the weirder. Or at least, it becomes more complex. I like your prediction of a new main character too: I think that will be necessary, especially after killing off Abu Nazir, Walden, and Estes all in the space of three episodes.”

5) “Whose ‘journalistic malfeasance?’ Fact-checking Joshua Foust’s Guardian critique” by Jay Pinho (June 17)

Money quote: “At the end, Foust laments the barrage of misleading and inaccurate news. He is right: the mainstream American press has had a rocky few months. (In reality, it’s been rocky for far longer than that.) Twitter and other real-time social networks have certainly contributed to the proliferation of these deceptions at ever-faster speeds, although they fact-check just as fast. I actually agree with the general thrust of Joshua Foust’s analysis of The Guardian‘s hasty reporting that appears to have cut corners in dangerous ways. But sometimes even the fact-checker needs a fact-checker.”

4) “A broken Constitution, and a few misplaced facts” by Jay Pinho (December 5)

Money quote: “I bring all this up not to rag on Toobin, who is obviously an astute legal mind. I enjoyed his article and am generally sympathetic to the complaints registered by the progressive movement regarding the Constitution’s many inadequacies. But several passages somehow slipped past The New Yorker‘s legendary fact-checking desk.”

3) “2013 March Madness: College Costs-Style” by Sam Lim (March 20)

Money quote: “In all seriousness, though, skyrocketing college costs are no laughing matter. Given that these numbers show how much students must pay (read: borrow) AFTER they’ve exhausted scholarships and grants, there’s already a great need to boost student financial aid and implement more student-friendly policies. If perhaps more schools followed New Mexico State’s lead (estimated annual net price: $2,344), we might actually be able to curb the growing student debt bubble a bit.”

2) “No Saint in this game: Is Wynn Resorts using Everett United to gain casino support?” by Jay Pinho (May 30)

Money quote: “Everett will get its chance to vote for or against the proposed casino in just a few short weeks. If, as expected, the residents approve the proposal and if Massachusetts subsequently awards the gaming license to Wynn and not either of his competitors, time will tell whether the ambitious project is beneficial to Everett in the long run. But it shouldn’t be too much to ask to ensure that Everett’s residents know just who is purporting to unite them.”

1) “My problem with TEDx” by Jay Pinho (February 17)

Money quote: “The ritualistic — at times almost mystical — nature of the event was deliberately designed so as to overwhelm each listener’s critical faculties with all the pomp and circumstance of a staged performance. It was no accident that, following the final lecture, we were all ushered quickly out to the neighboring lounge, where a bar had been set up with wine and beer, and where we were quickly serenaded by a singing theater troupe while we downed our various alcoholic beverages. The point is not to think: it’s to believe.”

Believe it or not, this list actually excludes the two single posts with the most page views this year: Victoria’s March 5th commentary on Jeffrey Toobin’s profile of Justice Ruth Bader Ginsburg (712 page views), and my May 26th “statistical jaunt” through more than 1,100 views from Dish readers’ windows (926 page views).

So yes, five of the 10 posts in this selection were written, at least in part, by Victoria and Sam. Their posts in aggregate represented a disproportionate number of eyeballs on the site, and — far more importantly — an even more disproportionate contribution to the quality of the blog itself.

Looking forward to 2014! Here’s your last song for the year:

Up, up, and away we go

Screen Shot 2013-04-02 at 5.48.20 PM

The month of March was a good one for The First Casualty. On several occasions in the past, I’ve mentioned that the site has been growing pretty quickly from month to month, but I’ve never shared specific numbers. So just for fun, I decided to open the kimono a bit this time — if for no other reason than to use the phrase “open the kimono,” which I have always found both overwhelmingly creepy and hilarious.

As the above graph illustrates, there’s a clear upward trend from January through March. The bars representing pageviews and visitors align with the axis at left, and the line representing posts corresponds to the axis at right. So last month I published 50 posts (many of which were written by Victoria Kwan and Sam Lim) and had 3,722 pageviews from 2,656 visitors.

A brief explainer: although I’ve been posting at jaypinho.com since December 2010 (and at 50 Books for 2010 since January of that year: all of the posts from that blog are archived and searchable here), I didn’t start making it a regular thing until roughly the end of September last year. Previously, it had been a hit-or-miss affair. Now it’s more of a project. Anyway, the huge drop-off from December 2012 to January of this year is simply due to the fact that I was in mainland China for the first two-thirds of January and had extremely limited access to social media (including WordPress) during that time.

However, while the pageviews and visitors decreased that month since I was posting less, the proportion (pageviews per post, for example) actually increased from December to January. But it wasn’t until March that it really took off: we came within 107 pageviews of besting The First Casualty‘s record month of December 2012 (3,828 views), but with fewer than half the posts (106 last December, only 50 this March).

The point? You guys — whoever you are out there in the Internet mists, scouring cyberspace for SCOTUS analysis, media criticism, and Red Sox fandom alike — have been great. Even better, there are more of you now than before. So thank you. Lastly, please feel free to post comments liberally (by which I mean “as much as you’d like:” comments from all across the political spectrum are welcomed).

Thanks again, and keep reading!

Enhanced by Zemanta

We are now fully Facebooked

like

As you may have noticed, I’ve finally brought The First Casualty into the 21st century. By this I mean, of course, that I’ve finally gotten rid of the old WordPress Like button and replaced it with a Facebook Like button (see above, if you’ve been living under a rock for about a decade or so). You may have also noticed that my posts now use Facebook’s commenting system as well. (Posts with pre-existing comments under the WordPress system will retain those comments, but you’ll now be able to add Facebook comments to them as well. However, the little comment counter under the headline for each post now only counts comments written using the Facebook system.)

These changes make sense on a bunch of levels. But the main reason — and the most obvious one as well — is that everyone’s on Facebook. Thus, by integrating its functionality into my site, I’ll be able to reach a broader audience and have a larger conversation this way. The Facebook-style comments and the Like button will work exactly the same way on The First Casualty as they would on any other blog or site.

Hope you enjoy, and don’t forget to Like and comment whenever the urge hits! Which should be often, of course.

Beyond the Dish meter, part II

A week ago, I took a look at Andrew Sullivan’s blogThe Dish, in order to see how the implementation of a “Read On” meter had affected the content structure of his blog. I found the following:

Bottom line: Andrew Sullivan has almost perfectly inverted his “Read On” content from before to after the implementation of the meter. From January 1 to 7, he posted 231 times; of those, only 52 (22.5%) included “Read On” buttons. Of those 52 “Read On” sections, 35 consisted primarily of third-party content (67.3%), 12 mostly contained material produced by Andrew and his readers (23.1%), and the remaining 5 were a combination of Andrew/readers and third-party content (9.6%).

From February 4 to 10, however, several things changed. The number of total posts was almost identical to the January period (227), but — as he promised — there were significantly fewer “Read On” posts in the first week of the new meter (27, or only 11.9% of the total). Of those 27, 19 contained content primarily contributed by Andrew and his readers (70.4%), 5 contained a combination (18.5%), and only 3 “Read On” sections during the entire week contained content mostly attributable to third parties (11.1%, or 1.3% of the entire population of posts this past week).

For more on the methodology of exactly how I categorized Sullivan’s various posts, see the original post. The first graph below depicts the stats for January 1 – 7, a week I chose as the control group for The Dish‘s content structure before the meter:

Before the meter.
Before the meter.

This second graph portrays the composition of The Dish‘s content from the very first full week that the meter was in effect, February 4 – 10:

Just after the meter.
The first week of the meter.

As Sullivan pointed out, The Dish rolled out the meter slowly in its first week: compared to the control week in January, when 22% of all posts contained “Read On” buttons, only 12% of all posts had the button in the first week of the meter. Furthermore, the type of content behind the meter was quite different: whereas the control period was dominated by third-party content beyond the “Read On” button, in the first week of the meter the majority of “Read On” sections primarily contained content produced by Andrew Sullivan and his readers.

Because that first week under the new meter was intended to be a bit of a test run, it remained to be seen how the stats would change (or stay the same) once the “Read On” button began to be used at a more normal frequency. So as a follow-up, I’ve now conducted an identical study of the very next week, February 11 – 17.

The total number of posts was similar to that of the previous two periods (237). Of those posts, 50 (21.1%) contained a “Read On” button: note that this is almost exactly the same percentage as in the control week (22.5%). Of those 50 sections located after the “Read On” button, 22 (44.0%) contained content primarily produced by Andrew and his readers, 20 (40.0%) contained content mostly taken from third-party sources, and the remaining 8 (16.0%) contained a combination of both. See the graph below:

The second week of the meter.

Again, I have shared the entire Excel spreadsheet here, in case anyone wishes to contest my methodology or categorization. As I mentioned in my original post:

Obviously, there is a small subjective element to the endeavor. However, this is probably much less significant than one might think: the vast majority of posts on The Dish – and this applies equally to the “Read On” and non-”Read On” sections of each post – quite clearly fall into one of the three categories specified above: content produced primarily by Andrew and/or his readers, content produced primarily by third parties, and content containing a mixture of both.

So after a pretty significant dip in “Read On” posts in the first week of the meter — while the kinks were being ironed out — The Dish‘s content has since returned to its pre-meter ratio of non-“Read On” to “Read On” posts. However, what lies beyond the meter has shifted: whereas 67.3% of all “Read On” sections before the meter contained mostly third-party content, now the plurality of “Read Ons” (44.0%) consist of content provided by Andrew and his readers (from analysis to letters to views from people’s windows). The proportion composed of third-party content has fallen to 40.0%, with the remaining 16.0% of all “Read On” sections comprised of material that contains both.

What this likely means is that Sullivan and his team have taken to heart the precautions of readers and commentators who noted that, to charge for content, the part that’s hidden to non-subscribers should tend to be more original — as opposed to a curation of third-party material.

One thing I didn’t touch on in my original post, but which I did measure, is the composition of every post before the “Read On” button — that is, the portion of each post one can see whether or not one is a subscriber. (This includes posts without a “Read On” button at all.) In the January 1 – 7 period, content was divided thusly: 67.5% of pre-“Read On” sections were primarily third-party content, 21.6% were content produced by Andrew Sullivan and his readers, and the remaining 10.8% were a mixture of both. (This was an almost identical proportion to the composition of the material after the “Read On” button during the same period.)

For the February 4 – 10 period, these numbers were: 64.8% = third-party content, 22.5% = Andrew/readers, and 12.8% = a combination. (I’m rounding to one decimal point here, so that’s why it doesn’t add up to exactly 100.0%.)

And for this last week (February 11 – 17), here are the proportions: 63.7% = third-party content, 21.5% = Andrew/readers, and 14.8% = a combination. Considering the fact that all three time periods had almost identical compositions of material before the “Read On” button, the significant changes in material beyond the button present an even starker contrast.

I believe Sullivan mentioned recently that if the pace of subscribers didn’t pick up, he may “nudge” them towards paying their dues. This could happen in one of two ways. Either he could reduce the number of monthly “Read On” clicks it takes to trigger the meter (it’s currently at seven), or he could introduce more “Read On” posts as a percentage of his total posts. As an early subscriber, it doesn’t really matter to me which one he chooses. But so far at least, the content lying beyond the “Read On” button certainly seems to justify the annual fee.

Enhanced by Zemanta

Read on and on: The Dish, before and after the meter

dishAs most of the world knows by now — and by that I refer mainly to people like the ones that populate my Twitter feed — Andrew Sullivan has cut himself loose. On Monday, February 4th, The Dish officially switched over from the Daily Beast to Sullivan’s own WordPress-hosted site.

The change comes with a few extra bells and whistles: no ads or clutter, automatic resizing on smartphones (although this has yet to work on my iPhone), infinite scrolling, and so on. Probably my favorite new feature is the search engine — or as Sullivan put it, “I have given a sharp dagger for anyone who wants to make me look foolish.” On the very first day his new site appeared, in fact, I inadvertently stumbled upon this gem from October 2002:

The last phony anti-war argument was that President Bush had yet to “make the case” for war against Iraq, as if grown-ups didn’t have the capacity to make their own minds up on the issue without constant guidance from the commander-in-chief. But that surely must now be in tatters as a point, since the president has made speech after speech in the last year clearly laying out the rationale for the war on terror, a rationale that has always included defanging Saddam.

Oops.

Anyway, the main transformation of The Dish is that it will now charge for its content. More precisely, after seven “Read On” clicks within a 30-day period, readers will be directed to a subscription page, where they’ll be able to sign up for a year of The Dish at the very manageable annual rate of $19.99.

As a medium-intensity Dish obsessive (on the spectrum, I’m somewhere between “regular reader” and “currently tattooing the Dish beagle to my forehead”) and aspiring journalist, I took great interest in Sullivan’s gamble, which basically amounted to throwing off the corporate chains — chains that were accompanied, of course, by a large financial backing — and going it alone. I began to wonder, as did many other readers, how the switch from a principally advertising-supported venture to one backed directly by the readers would affect the content and form of The Dish itself.

This being Andrew Sullivan, he was only too happy to share his readers’ concerns in the days leading up to the switchover. (In fact, Sullivan’s masochistic willingness, rare among bloggers, to frequently publish reader emails excoriating his commentary is one of the main reasons I was so happy to subscribe to the new reader-supported iteration of The Dish.)

After Sullivan published one reader’s blunt adieu to The Dish on January 3rd — “For better or worse I like my Internet free,” (s)he declared, and then, one hopes, enrolled in Microeconomics 101 — he reassured his audience: “A reminder to our reader and others that the vast majority of Dish content will remain free to non-members.”

Two weeks later, in response to more reader reactions, Sullivan again noted: “Even if all of my longer posts are metered, only a portion of my writing will go behind the read-on, thus allowing all readers to get the gist of the post, regardless of subscription.”

Perhaps most interestingly to me, however, was the cautionary point raised by another reader several days earlier:

Another reader worries that “there may be potential copyright issues if it was less than 50% original content/comments by the Dish team with a “charge” being issued by the Dish.” But another writes:

The read-on might actually work to the external sources’ advantage, in that non-payers will then have more reason to follow the link to the original if they’re interested.

The above-mentioned post, in fact, contained a variety of creative suggestions from readers as to how, exactly, Sullivan should handle the “Read On” issue. Now that all content beyond the “Read On” button (after the first seven monthly clicks, that is) requires payment, it would be interesting to see just what type of content Sullivan is placing behind the “paywall” (a term Sullivan himself dislikes but which more or less describes his new model).

Long story short: I’ve just now completed such a study. First, I analyzed every post on The Dish in the one-week period from January 1 to January 7, 2013, in which I categorized each entry by:

A) whether it included a “Read On” button

B) what type of content came before the “Read On” button (as in, the part that is visible without expanding the post): (1) primarily Sullivan and/or reader commentary, (2) primarily third-party content (e.g. excerpts from an article, column, or essay), or (3) a combination of both Sullivan/readers and third-party content (as when Sullivan excerpts articles and then critiques their points, rather than, for example, simply excerpting another article rebutting the first one)

C) what type of content came beyond the “Read On” button (using the same criteria), if there was one

I chose the first week of 2013 (somewhat arbitrarily) as my control group because it preceded the implementation of the meter model. I then performed the same analysis on all posts on The Dish in the week from February 4th (the first full day under the new meter model) to February 10th. (All times are in EST, by the way.)

A few caveats are in order. First, as Andrew Sullivan himself made clear, the opening week of his new site is not exactly a perfect representation of how the “Read On” button will be utilized in the future. On February 6th, in response to a reader who questioned the additional value granted by subscribing, Sullivan noted:

That’s because after two days, we’ve been going easy on the meter. We’ll adjust as we go along. We want to keep the majority of the site free, but the deeper analyses, reader threads, my own writing, and other features will slowly become less accessible to the non-subscriber. It’s a balance, and we’re trying to figure our way forward with it.

As you will see below, so far this formulation has meant a significant departure from Sullivan’s use of “Read On” prior to the advent of the meter. Back then, in my sample, over two-thirds of all “Read On” segments — that is, the portions of his posts that lay beyond the “Read On” button — consisted primarily of third-party content. Now, however, “deeper analyses, reader threads, [his] own writing, and other features” have gained an increasing share of the “Read On” pie. (Again, keep in mind that things are still in flux: it’s only been a week.)

A second caution applies to my criteria for categorizing the posts. Obviously, there is a small subjective element to the endeavor. However, this is probably much less significant than one might think: the vast majority of posts on The Dish — and this applies equally to the “Read On” and non-“Read On” sections of each post — quite clearly fall into one of the three categories specified above: content produced primarily by Andrew and/or his readers, content produced primarily by third parties, and content containing a mixture of both.

To use some of his more popular features as an example, both sections of a typical “View From Your Window” post (both the content before and beyond the “Read On” button, in other words) would obviously fall into the first category. A “Mental Health Break,” which rarely contains a “Read On” button, would usually fit into the second, since these posts generally consist of a video produced by someone else with no more than an accompanying line or two from Sullivan. And an “Yglesias Award Nominee” post, while possibly fitting into the second category, often instead went into the third — as Sullivan frequently added his own commentary to the quote itself (either in the pre- or post-“Read On” sections of the post). Anyway, in the interest of transparency, I have included a link to my full Excel spreadsheet analysis here.

Bottom line: Andrew Sullivan has almost perfectly inverted his “Read On” content from before to after the implementation of the meter. From January 1 to 7, he posted 231 times; of those, only 52 (22.5%) included “Read On” buttons. Of those 52 “Read On” sections, 35 consisted primarily of third-party content (67.3%), 12 mostly contained material produced by Andrew and his readers (23.1%), and the remaining 5 were a combination of Andrew/readers and third-party content (9.6%).

Screen Shot 2013-02-11 at 1.02.23 AM

From February 4 to 10, however, several things changed. The number of total posts was almost identical to the January period (227), but — as he promised — there were significantly fewer “Read On” posts in the first week of the new meter (27, or only 11.9% of the total). Of those 27, 19 contained content primarily contributed by Andrew and his readers (70.4%), 5 contained a combination (18.5%), and only 3 “Read On” sections during the entire week contained content mostly attributable to third parties (11.1%, or 1.3% of the entire population of posts this past week).

Screen Shot 2013-02-11 at 1.03.58 AM

Of course, only time will tell if this trend of more original material after the “Read On” button continues. It would certainly make sense, since this section is now being charged for after seven monthly clicks (which probably took the average Dish reader, what, five minutes to hit on February 4th?). I’d expect the percentage of posts that contain “Read On” buttons to rise pretty soon, because that’s one of the primary added-value propositions of subscribing. But I suppose how quickly this all happens will depend on a number of factors, including how many new subscribers Sullivan is scooping up on a regular basis now that more and more casual readers are starting to hit the meter.

In any case, I’m excited to see a blogger of Sullivan’s caliber jumping into such a bold experiment, and I wish him the best! I certainly don’t always agree with him, but even when he’s wrong, he’s never boring.

Back from Internet hell

Courtesy of Colossal (http://www.thisiscolossal.com/2013/01/brooding-cityscapes-painted-with-oil-by-jeremy-mann).
Courtesy of Jeremy Mann and Colossal (http://www.thisiscolossal.com/2013/01/brooding-cityscapes-painted-with-oil-by-jeremy-mann).

For an Internet addict like myself, the last couple weeks have been difficult. Access to foreign sites in mainland China is frustrating at best and infuriating at worst. Specifically, aside from the usual litany of blocked social media sites (Facebook, Twitter, and YouTube, for example), even the New York Times is blocked, and virtually every other foreign site (including Google) takes five times as long to load as it does in the States. Baidu, meanwhile, appears instantly. Ergh.

I just got back to New York yesterday. But during my winter vacation, I’ve been doing some thinking about how to make The First Casualty a better and funner (yes, I have decided that is a word) blog and Internet destination in 2013. Within the next few weeks and months I’m planning to roll out some new — and, hopefully, interesting — ideas for the blog: new contributors, additional features, and so on. Of course, I’ll be continuing the current features and contributors (depending on their availability) as well.

Additionally, I hope to introduce more original content this year. Much of what I posted last year were links to, and excerpts of, other pieces I found illuminating or provocative. I’ll continue to do so this year, but with an added emphasis on producing more original writing — including longform essays and posts — to provide what is hopefully a useful and unique variant to the cacophony of voices on the Web.

Anyway, I’m open to suggestions. Please comment and question liberally. And thank you for continuing to read.

Technical problems

It seems social media and blogging platforms are just as difficult to use in China as one might expect. I’ve now tried (multiple times) to upload a photo or two to the blog, to no avail. So I suppose I’ll be sticking with text now, for the next few weeks.

Anyway, Happy New Year! I will try to post slightly more often during the next couple of weeks than I have for the last week or so (that is, none at all). But a lot of that will depend on how stringent the…ahem, controls are here.

Gone fishin’

fishing

I’m leaving New York (and the country) today and won’t return until just past mid-January, so my posting will be very sporadic for the next few weeks.

December was another record month in blog visits. In fact, of the last four months of 2012, three of them set new blog records for visits (I fell behind a bit in November). As always, thank you all very much for reading and commenting, and now…onward to 2013! Stick around!

Happy New Year.